Understand the events involved in NetSim DES (Discrete Event Simulator) in simulating the flow of one packet from a Wired node to a Wireless node
Theory#
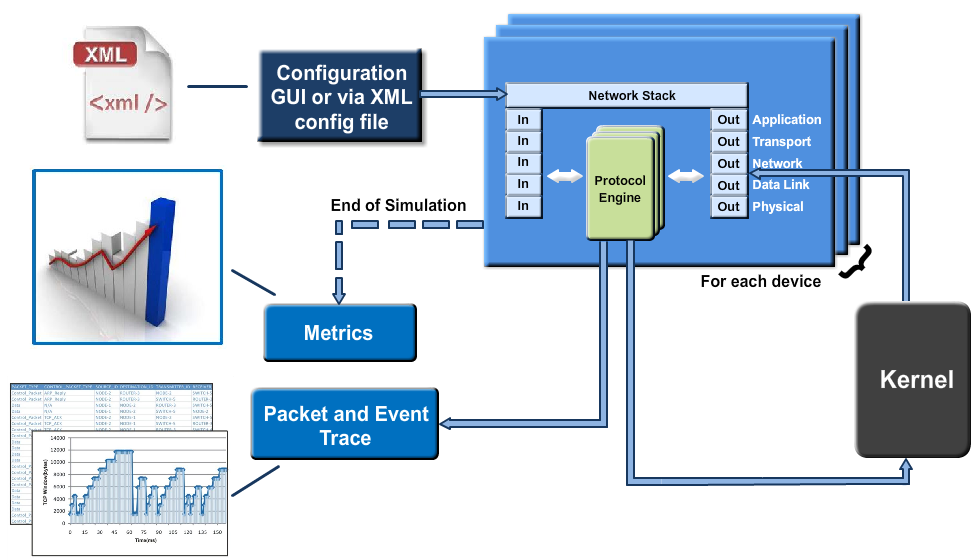
NetSim's Network Stack forms the core of NetSim and its architectural aspects are diagrammatically explained below. Network Stack accepts inputs from the end-user in the form of Configuration file and the data flows as packets from one layer to another layer in the Network Stack. All packets, when transferred between devices move up and down the stack, and all events in NetSim fall under one of these ten categories of events, namely, Physical IN, Data Link IN, Network IN, Transport IN, Application IN, Application Out, Transport OUT, Network OUT, Data Link OUT and Physical OUT. The IN events occur when the packets are entering a device while the OUT events occur while the packet is leaving a device.
 {width="4.333333333333333in"
height="2.4895833333333335in"}
{width="4.333333333333333in"
height="2.4895833333333335in"}
Figure 32‑1: Flow of one packet from a Wired node to a Wireless node
Every device in NetSim has an instance of the Network Stack shown above. Switches & Access points have a 2-layer stack, while routers have a 3 layer stack. End-nodes have a 5-layer stack.
The protocol engines are called based on the layer at which the protocols operate. For example, TCP is called during execution of Transport IN or Transport OUT events, while 802.11b WLAN is called during execution of MAC IN, MAC OUT, PHY IN and PHY OUT events.
When these protocols are in operation, they in turn generate events for NetSim\'s discrete event engine to process. These are known as SUB EVENTS. All SUB EVENTS, fall into one of the above 10 types of EVENTS.
Each event gets added in the Simulation kernel by the protocol operating at the particular layer of the Network Stack. The required sub events are passed into the Simulation kernel. These sub events are then fetched by the Network Stack in order to execute the functionality of each protocol. At the end of Simulation, Network Stack writes trace files and the Metrics files that assist the user in analyzing the performance metrics and statistical analysis.
Event Trace
The event trace records every single event along with associated information such as time stamp, event ID, event type etc. in a text file or .csv file which can be stored at a user defined location.
Network Setup#
Open NetSim and click on Experiments> Internetworks> Network Performance> Advanced Simulation events in NetSim for transmitting one packet then click on the tile in the middle panel to load the example as shown in below Figure 32‑2.
 {width="6.260416666666667in"
height="3.352777777777778in"}
{width="6.260416666666667in"
height="3.352777777777778in"}
Figure 32‑2: List of scenarios for the example of Advanced Simulation events in NetSim for transmitting one packet
NetSim UI displays the configuration file corresponding to this experiment as shown below Figure 32‑3.
 {width="3.8115813648293964in"
height="1.914453193350831in"}
{width="3.8115813648293964in"
height="1.914453193350831in"}
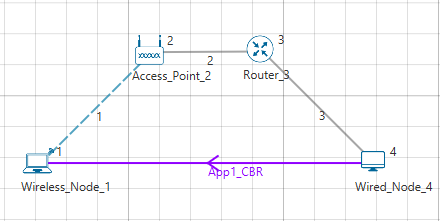
Figure 32‑3: Network set up for studying the Advanced Simulation events in NetSim for transmitting one packet
Procedure#
The following set of procedures were done to generate this sample:
Step 1: A network scenario is designed in NetSim GUI comprising of 1 Wired Node, 1 Wireless Node, 1 Router, and 1 Access Point in the "Internetworks" Network Library.
Step 2: The device positions are set as per the below table Table 32‑1.
Device
Positions
          **Access Point   **Wired Node   **Wireless Node   **Router 3**
          2**              4**            1**
X / Lon 150 250 100 200
Y / Lat 50 100 100 50
Table 32‑1: Devices Positions
Step 3: Right-click the link ID (of the wireless link) and select Properties to access the link's properties. The "Channel Characteristics" is set to NO PATHLOSS.
Step 4: Right-click on the Application Flow App1 CBR and select Properties or click on the Application icon present in the top ribbon/toolbar.
A CBR Application is generated from Wired Node 4 i.e. Source to Wireless Node 1 i.e. Destination with Packet Size remaining 1460 Bytes and Inter Arrival Time remaining 20000µs.
Transport Protocol is set to UDP instead of TCP.
Step 5: Event Trace is enabled in NetSim GUI.
Step 6: Run the simulation for 10 secs. At the end of the simulation, a very large .csv file is containing all the UDP IN and OUT EVENTS is available for the users. Plots are enabled in NetSim GUI.
Note: Event trace is only available only in NetSim Standard and Pro versions.
Output#
Once the simulation is complete, go to the Results Dashboard and in the left-hand-side of the window, click on the \"Open Event Trace\" Option. An Event trace file similar to the following opens in Excel as shown below:
 {width="6.307695756780403in"
height="2.3895811461067367in"}
{width="6.307695756780403in"
height="2.3895811461067367in"}
Figure 32‑4: Event trace
We start from the APPLICATION_OUT event of the first packet, which happens in the Wired Node and end with the MAC_IN event of the WLAN_ACK packet which reaches the Wired Node. Events in the event trace are logged with respect to the time of occurrence due to which, event id may not be in order.
Events Involved#
Events are listed in the following format:
[EVENT_TYPE, EVENT_TIME, PROTOCOL, EVENT_NO, SUBEVENT_TYPE]
[APP_OUT, 20000, APP, 6, -]
[TRNS_OUT, 20000, UDP, 7, -]
[NW_OUT, 20000, IPV4, 9, -]
[MAC_OUT, 20000, ETH, 10, -]
[MAC_OUT, 20000, ETH, 11, CS]
[MAC_OUT, 20000.96, ETH, 12, IFG]
[PHY_OUT, 20000.96, ETH, 13, -]
[PHY_OUT, 20122.08, ETH, 14, PHY_SENSE]
[PHY_IN, 20127.08, ETH, 15, -]
[MAC_IN, 20127.08, ETH, 16, -]
[NW_IN, 20127.08, IPV4, 17, -]
[NW_OUT, 20127.08, IPV4, 18, -]
[MAC_OUT, 20127.08, ETH, 19, -]
[MAC_OUT, 20127.08, ETH, 20, CS]
[MAC_OUT, 20128.04, ETH, 21, IFG]
[PHY_OUT, 20128.04, ETH, 22, -]
[PHY_OUT, 20249.16, ETH, 23, PHY_SENSE]
[PHY_IN, 20254.16, ETH, 24, -]
[MAC_IN, 20254.16, ETH, 25, -]
[MAC_OUT, 20254.16, WLAN, 26, -]
[MAC_OUT, 20254.16, WLAN, 27, DIFS_END]
[MAC_OUT, 20304.16, WLAN, 28, BACKOFF]
[MAC_OUT, 20324.16, WLAN, 29, BACKOFF]
[MAC_OUT, 20344.16, WLAN, 30, BACKOFF]
[MAC_OUT, 20364.16, WLAN, 31, BACKOFF]
[PHY_OUT, 20364.16, WLAN, 32, -]
[TIMER, 21668.16, WLAN, 35, UPDATE_DEVICE_STATUS]
[PHY_IN, 21668.4, WLAN, 33, -]
[MAC_IN, 21668.4, WLAN, 36, RECEIVE_MPDU]
[NW_IN, 21668.4, IPV4, 37, -]
[MAC_OUT, 21668.4, WLAN, 38, SEND_ACK]
[TRNS_IN, 21668.4, UDP, 39, -]
[APP_IN, 21668.4, APP, 41, -]
[PHY_OUT, 21678.4, WLAN, 40, -]
[TIMER, 21982.4, WLAN, 43, UPDATE_DEVICE]
[PHY_IN, 21982.63, WLAN, 42, -]
[MAC_IN, 21982.63, WLAN, 44, RECEIVE_ACK]
[TIMER, 21985, WLAN, 34, ACK_TIMEOUT]
[Event Flow Diagram for one packet from Wired Node to Wireless Node]{.underline}
 {width="6.268055555555556in"
height="6.840972222222222in"}Figure 32‑5: Event Flow Diagram for one
packet from Wired Node to Wireless Node
{width="6.268055555555556in"
height="6.840972222222222in"}Figure 32‑5: Event Flow Diagram for one
packet from Wired Node to Wireless Node
For Example
MAC_OUT in the Access Point involves sub events like CS, DIFS_END and BACKOFF.
As you can see in the trace file shown below, CS happens at event time 20254.16,
Adding DIFS time of 50µs to this will give DIFS_END sub event at 20304.16. Further it is followed by three Backoff's each of 20 µs, at event time 20314.16, 20324.16, 20344.16 respectively.
 {width="6.232970253718285in"
height="2.924527559055118in"}
{width="6.232970253718285in"
height="2.924527559055118in"}
Figure 32‑6: Sub events like CS, DIFS_END and BACKOFF event times
In this manner the event trace can be used to understand the flow of events in NetSim Discrete Event Simulator.
Discussion#
In NetSim each event occurs at a particular instant in time and marks a change of state in the system. Between consecutive events, no change in the system is assumed to occur. Thus the simulation can directly jump in time from one event to the next.
This contrasts with continuous simulation in which the simulation continuously tracks the system dynamics over time. Because discrete-event simulations do not have to simulate every time slice, they can typically run much faster than the corresponding continuous simulation.
Understanding NetSim's Event trace and its flow is very much helpful especially when customizing existing code and debugging to verify the correctness the modified code. The event IDs provided in the event trace can be used to go to a specific event while debugging.