In-flight connectivity over 5G/6G NTN
LEO constellation · Ka band · Earth-moving beams
We compare in-flight connectivity over a Bangalore to Delhi flight for two constellation sizes, 50 and 100 satellites, measured by SINR, throughput, and latency. We model the constellation and its orbits, the antennas and the RF channel, and the flight path. NetSim then simulates the entire flight and reports each KPI.
What you can model
Simulate end to end: satellite orbits, antennas and RF, the flight path, and protocol operation, then analyse throughput and latency.
Constellation size
Change the constellation size. Hold the route, the radio, and the traffic fixed, then read the effect on delivered service.
Serving-satellite association
Follow the satellite that serves the aircraft at each instant. See how long it holds, and when service passes to the next one.
Link budget in motion
Track elevation angle, slant range, beam gain, and path loss as the aircraft and the satellites move.
What the cabin receives
Measure application throughput and packet delay at the aircraft, where the passenger session runs.
The scenario
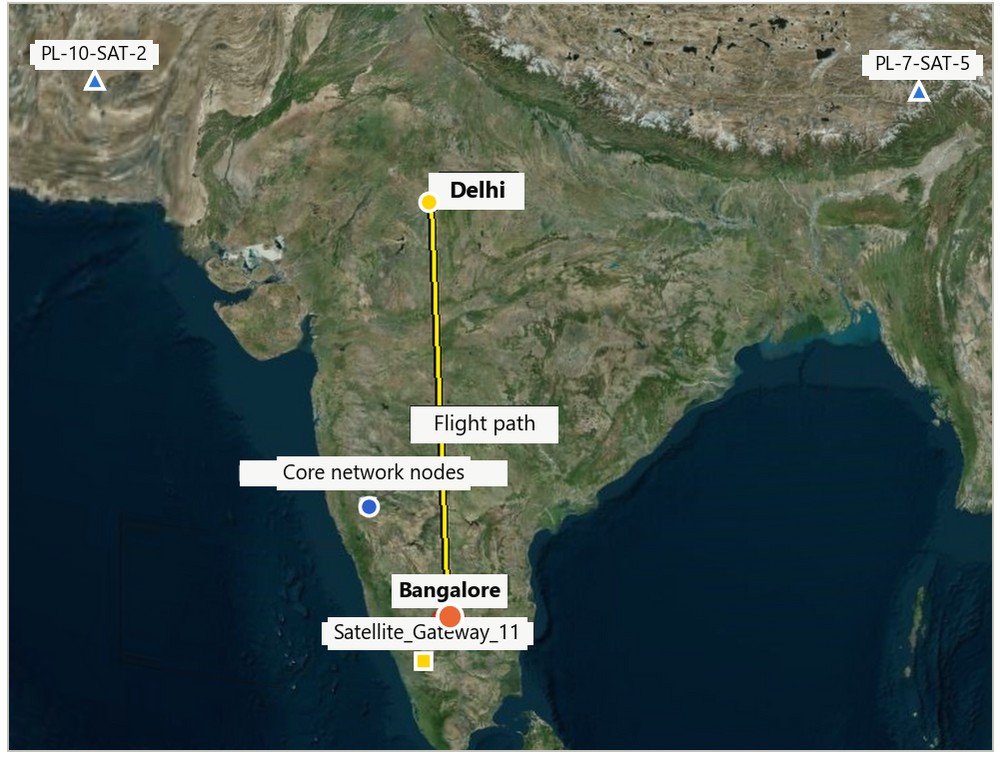
The aircraft flies from Bangalore to Delhi in 2 h 12 min at about 800 km/h. The Ka-band satellites are at 550 km altitude, with 200 MHz bandwidth and an EIRP density of 59 dBW/MHz. A saturation traffic load measures the maximum throughput the link can deliver.
Bangalore to Delhi, 2 h 12 min
- File Based Mobility moves the aircraft along time-stamped waypoints
- 1739.81 km straight-line route over a 7920 s simulation
- NetSim derives the speed from the waypoint spacing: about 790.82 km/h, or 427.00 knots
Ka band n510, 200 MHz
- 200 MHz downlink and 200 MHz uplink
- Gaussian antenna model, with one Earth-moving beam per satellite
- Free-space path loss with a 10 degree elevation mask
- Aircraft antenna gain 25 dB, maximum antenna gain 30 dB, EIRP density 59 dBW/MHz
Downlink full buffer over UDP
- Remote server to aircraft, with 4000 packets in flight
- While a satellite serves the aircraft, the downlink runs as fast as the link allows
- The two runs differ in one parameter only: 50 satellites against 100
See the flight in NetSim
The aircraft leaves Bangalore for Delhi while the 50-satellite constellation moves overhead. The serving satellite changes along the route, and the application throughput updates as the run plays.
The end-to-end path
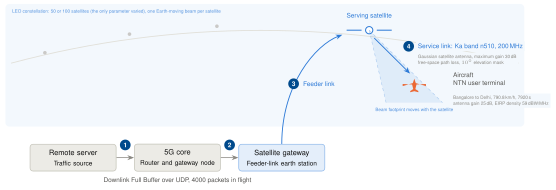
Traffic reaches the cabin through the 5G core and the satellite gateway. Each satellite carries one Earth-moving beam, so the footprint travels with the satellite. The aircraft receives service only inside that footprint.
Scroll sideways to see the whole diagram.
The downlink path runs in traffic order. Full Buffer traffic starts at the remote server (1) and crosses the 5G core to the satellite gateway (2). The traffic then climbs the feeder link to the serving satellite (3) and reaches the aircraft over the Ka-band service link (4).
Why the serving satellite changes
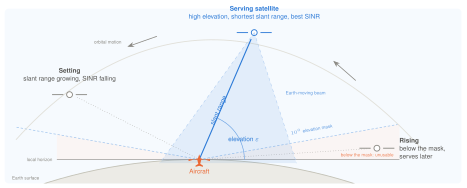
Two conditions must hold together. The satellite must sit above the 10 degree elevation mask, and the aircraft must lie inside its beam. Elevation angle and slant range change all the time, and both drive the received SINR.
Scroll sideways to see the whole diagram.
The serving satellite offers the highest elevation and the shortest slant range. The setting satellite loses SINR as its slant range grows. The rising satellite still sits below the mask, so it cannot serve yet. When no satellite meets both conditions, service stops, and the timeline below shows a gap.
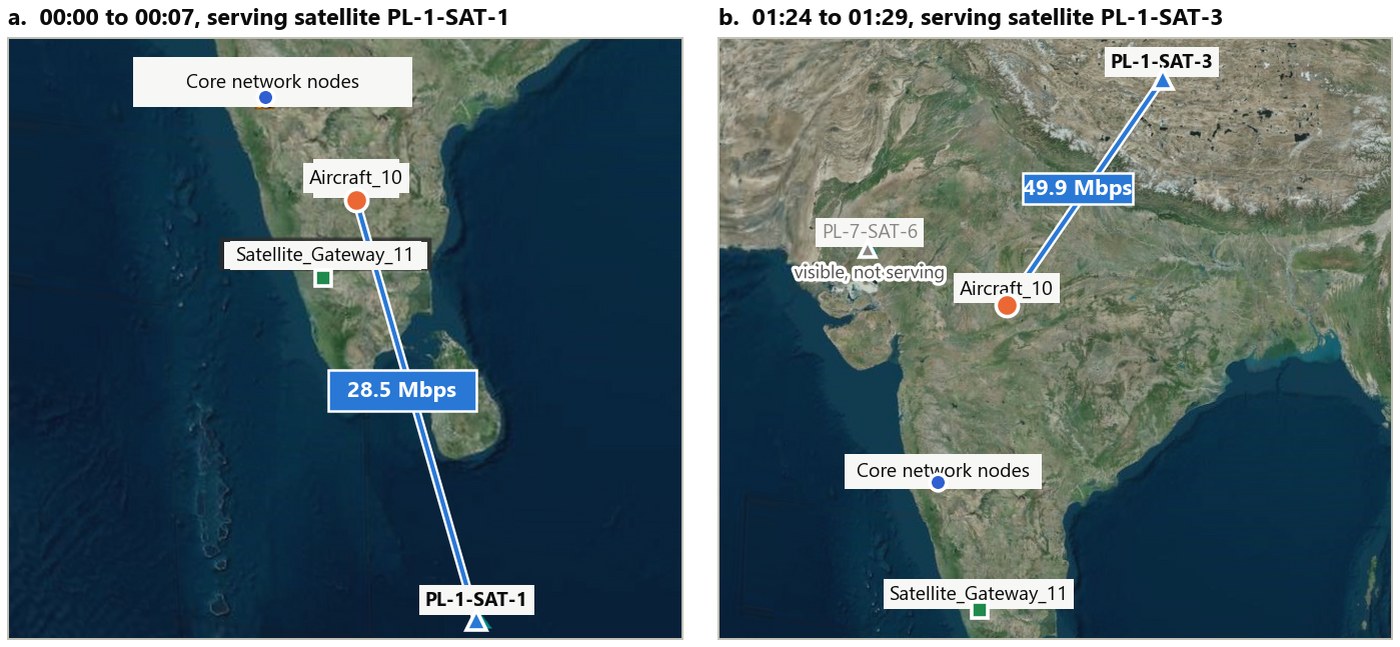
Two instants in the 100-satellite run. The blue link and the throughput badge mark the serving satellite. Early in the flight PL-1-SAT-1 serves the aircraft at 28.5 Mbps. Ninety minutes later PL-1-SAT-3 serves it at 49.9 Mbps, while another satellite stays visible but does not serve.
50 satellites against 100
The route, the radio and the traffic stay the same. Only the constellation size changes, so the difference shows what those extra satellites are worth.
The satellite handover timeline
Each bar is service with a serving satellite. Lane represents the orbital plane, and its shade gives the SINR. The blank stretches are gaps, where no satellite serves the aircraft.
Scroll sideways to follow the whole flight.
Orbital planes take turns
The aircraft alternates between orbital planes PL-1 and PL-7 for most of the route. The handover sequence follows whichever plane has a satellite above the mask.
Dwell time falls as density rises
Doubling the constellation cuts the mean dwell from 6.2 min to 4.8 min. Each satellite holds the aircraft for a shorter part of its pass, and handovers rise from 13 to 19 in step.
Over the flight
We compare the two runs over a common time axis. The shaded bands are the gaps, where no satellite serves the aircraft.
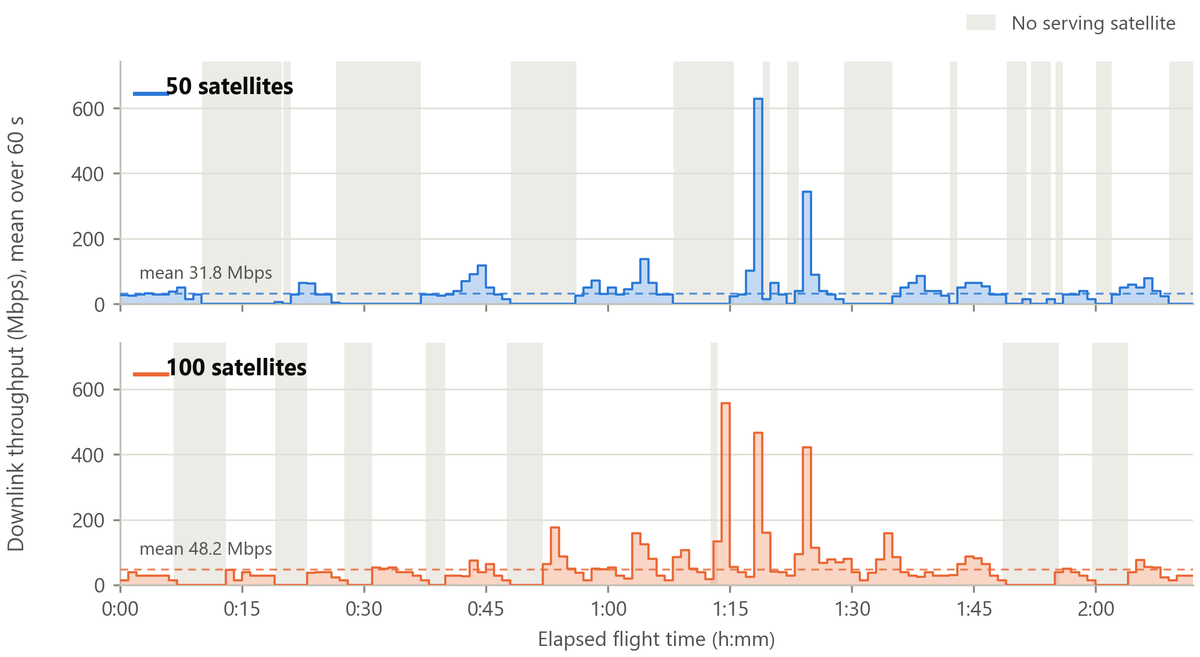
Both runs stay below 50 Mbps for most of the flight. Each run peaks above 400 Mbps when the aircraft passes close to beam centre at high elevation. The 100-satellite run holds a higher floor and shows fewer, narrower gaps.
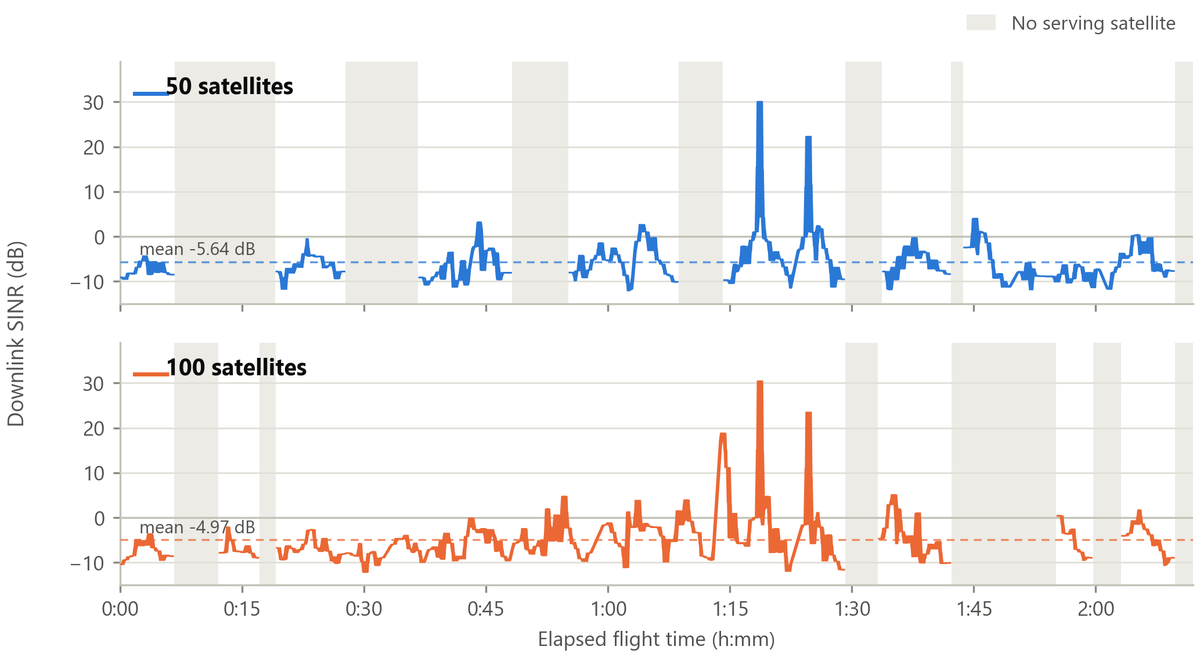
Downlink SINR stays below 0 dB for most of the flight in both runs. The 100-satellite run holds a higher mean, and it steps more often because its serving intervals are shorter.
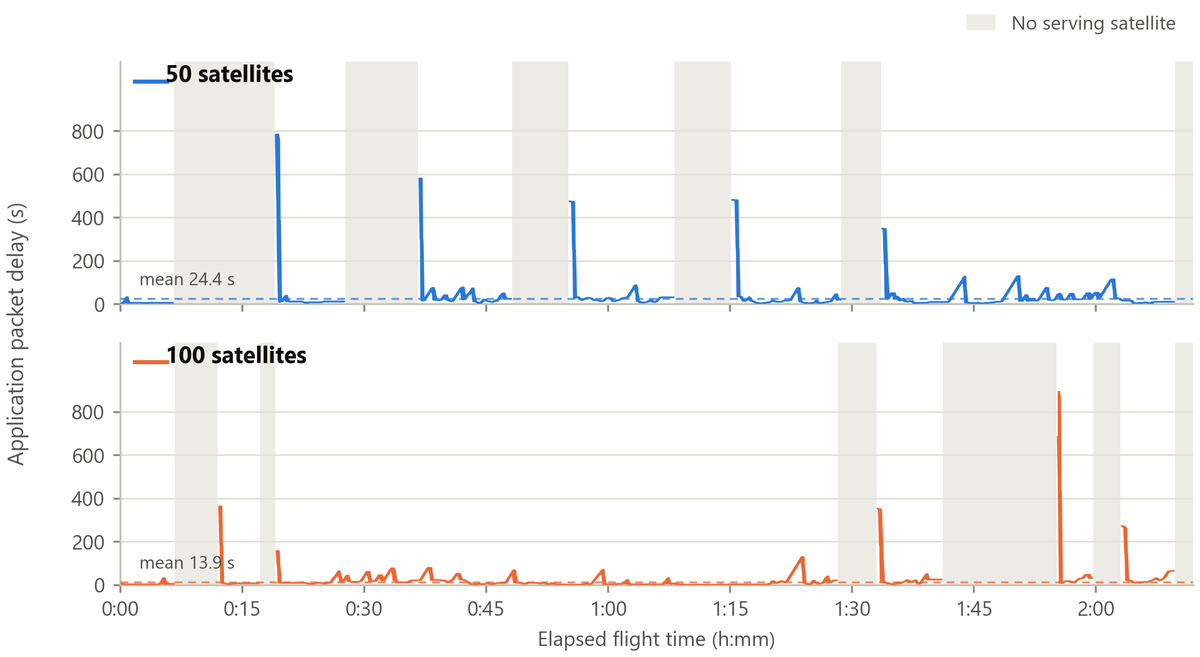
Every large delay spike falls immediately after a gap. The queue drains once the link returns, so the spikes show backlog rather than propagation delay.
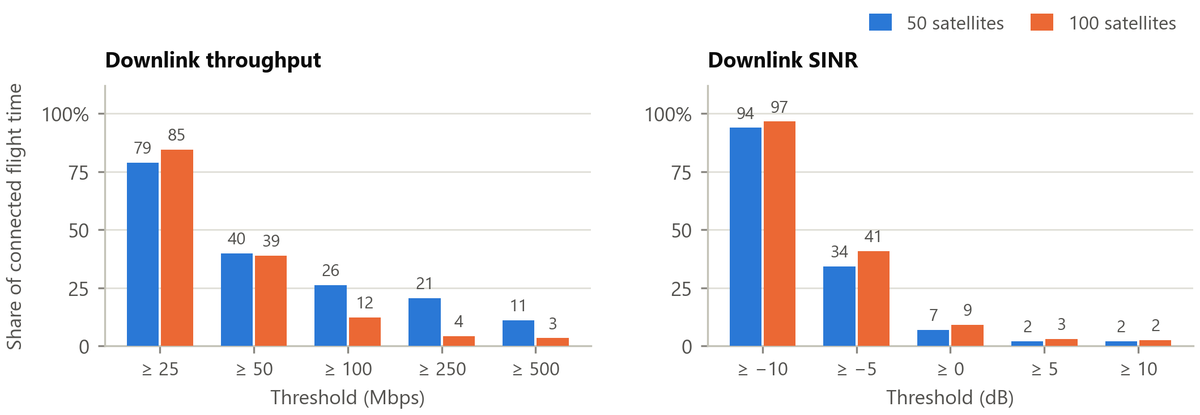
Each bar represents the share of connected time spent above that level. The 100-satellite run spends more of the flight in good radio conditions. It stays above 25 Mbps for 85 per cent of connected time, against 79, and above −5 dB for 41 per cent, against 34. That extra time at the better levels lifts its mean SINR from −5.64 dB to −4.97 dB.
What the result means
Doubling the constellation buys availability: more minutes of the flight with a serving satellite, and shorter gaps between them.
The gain is coverage
Both runs reach similar peaks: SINR near 30 dB, and throughput above 400 Mbps close to beam centre. The gain shows up in service availability, which rises from 61 to 70 per cent of the flight.
The delay spikes follow the gaps
Under full-buffer downlink the baseline delay runs to tens of seconds. Every large spike follows a gap, as queued traffic drains once the link returns. Shorter gaps halve the mean, from 24.43 s to 13.93 s.
More satellites, more handovers
Nineteen serving intervals instead of 13 means more handovers to carry. The sparser constellation holds one satellite for 6.2 min. That longer dwell rides further into the high-elevation part of each pass, so it keeps more time at the highest thresholds.
Related product
Satellite link budget and coverage planning
Where NetSim simulates the network, NetSim Astra plans the constellation over real geography. Use the two together to move from coverage design to end-to-end performance.
- Constellation and orbital-plane design
- Link budgets for satellites
- Coverage and footprint studies over real geography
Useful links
Read the full write-up, explore the NTN library behind this study, or ask us to run your own route.