Simulating 5G HetNets
5G heterogeneous networks (HetNets) usually have a multi-tier structure, with two or more types of BSs in the same or different frequency bands. For example, macro BSs are sparser and have higher transmit power. Small (or micro) BSs are denser and have lower transmit power.
The following steps explain one way to simulate a 5G HetNet in NetSim
- Drag and drop base stations (gNBs), and UEs per your topology
- Have N classes of BSs (say 2 namely macro and small) based on frequency, transmit power, and bandwidth
- Let the properties of the 2 classes be: Frequency F1, F2, Bandwidth: B1, B2, and Transmit Power: P1, P2. The antenna types and counts can also be different between the different classes of BSs
- NetSim calculates pathloss from the frequency and location of the UEs and BSs. You can also enable shadowing and fading, and set a different pathloss model for each tier.
- By default, each UE associates with the BS from which it receives the highest power (to be precise, the highest SSB channel SNR). To simulate other association rules, such as biasing for small cells, modify the source code.
- UEs will see DL interference from other BSs transmitting in the same frequency.
- You can configure UE mobility. Handover can occur within and across the HetNet tiers. You can configure A3 event-based handover parameters such as TTT and Offset.
- All BSs have wired backhaul to the core.
An example
Objective
In a 5G heterogeneous network, we analyze how the handover margin and time-to-trigger affect two metrics: the number of handovers and the sum throughput (the aggregate throughput of all UEs).
System Model
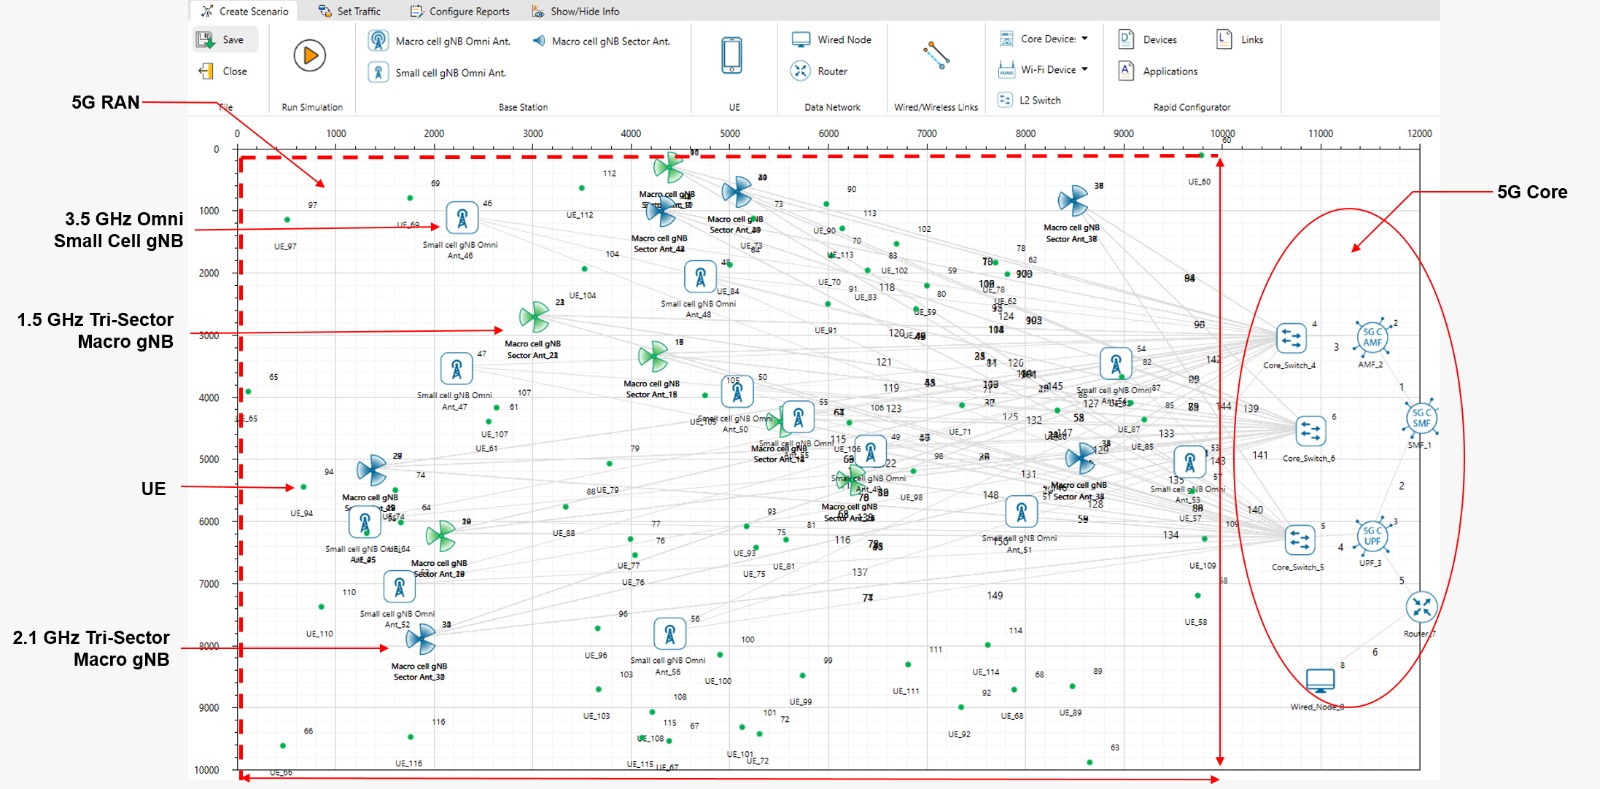
The example is based on a 3-tier 5G HetNet simulation. The network comprises three gNB tiers at 1.5 GHz, 2.1 GHz, and 3.5 GHz.
| Tier Number | Frequency (GHz) | Pathloss Exponent | Transmit Power (dBm) | Antenna Type | Antenna Height (m) | Channel Bandwidth (MHz) |
|---|---|---|---|---|---|---|
| Tier 1 gNBs | 1.5 | 2.9 | 37 | Sector (3 Nos) | 30 | 10 |
| Tier 2 gNBs | 2.1 | 2.9 | 37 | Sector (3 Nos) | 30 | 15 |
| Tier 3 gNBs | 3.5 | 3.9 | 30 | Omni-Directional | 20 | 50 |
Each tier has a specific pathloss exponent influencing signal attenuation. The transmit power, antenna types (sector and omni-directional), and antenna heights vary across tiers. The simulation area is 10 km × 10 km. It has 60 UEs, 18 tier-I gNBs, 18 tier-II gNBs and 12 tier-III gNBs, all placed at random. The simulation parameters include gNB and UE antenna configurations, pathloss models, interference models and mobility settings. A lognormal distribution with a standard deviation of 5 dB models the shadowing. The gNBs in different tiers do not interfere, because they operate at different frequencies.
| Simulation Area | 10 km * 10 km |
| Number of UEs | 60 (distributed randomly) |
| Number of Tier 1 gNBs | 18 (distributed randomly) |
| Number of Tier 2 gNBs | 18 (distributed randomly) |
| Number of Tier 3 gNBs | 12 (distributed randomly) |
| gNB Tx*Rx Antenna Count | 1*1 |
| UE Tx*Rx Antenna Count | 1*1 |
| gNB Pathloss Model | Log Distance |
| gNB Shadow Fading Model | None |
| Downlink Interference Model | Exact Geometric Model |
| Mobility Model | Random Walk |
| Velocity | 33 m/s |
| Calculation (update) interval for mobility | 0.12 s (120 ms) |
| Shadowing | Lognormal. Std. dev. = 5 dB |
| Time to trigger (ms) | Varies: 128, 256, 512, 1024 |
| Handover Margin (dB) | Varies: 0, 1, 2, 3, 4, 5, 6 |
| Handover model | A3 event based |
| Simulation Time | 30s |
| Traffic Model | Saturated (Full buffer) DL |
Handover Algorithm: The 5G handover procedure in NetSim is based on the Strongest Adjacent Cell Handover Algorithm (Ref: Handover within 3GPP LTE: Design Principles and Performance. Konstantinos Dimou. Ericsson Research).
The algorithm connects each UE to the gNB that provides the highest Reference Signal Received Power (RSRP). A handover therefore occurs as soon as the UE detects a better gNB, that is, an adjacent cell with an RSRP stronger by the offset (NetSim measures it as SNR). This is similar to Event A3 in TS 38.331, Section 5.5.4.4, in which the RSRP of the neighbour cell becomes Offset better than the RSRP of the serving cell.
Handover parameters: The Time to Trigger (TTT) and Handover Margin (HO Margin) are the variables in the study. The study uses an A3 event-based handover model. An Event A3-based HO triggers when
- The SINR of a user from the target gNB becomes higher than the SINR of the user from the serving gNB by an offset. This offset is the handover margin.
- This condition (C1) holds for a duration called the time to trigger.
The model focuses on the interaction of these parameters and their effect on network performance, measured in terms of handover count and sum throughput.
The scenario in NetSim looks as shown below.
Results and discussion
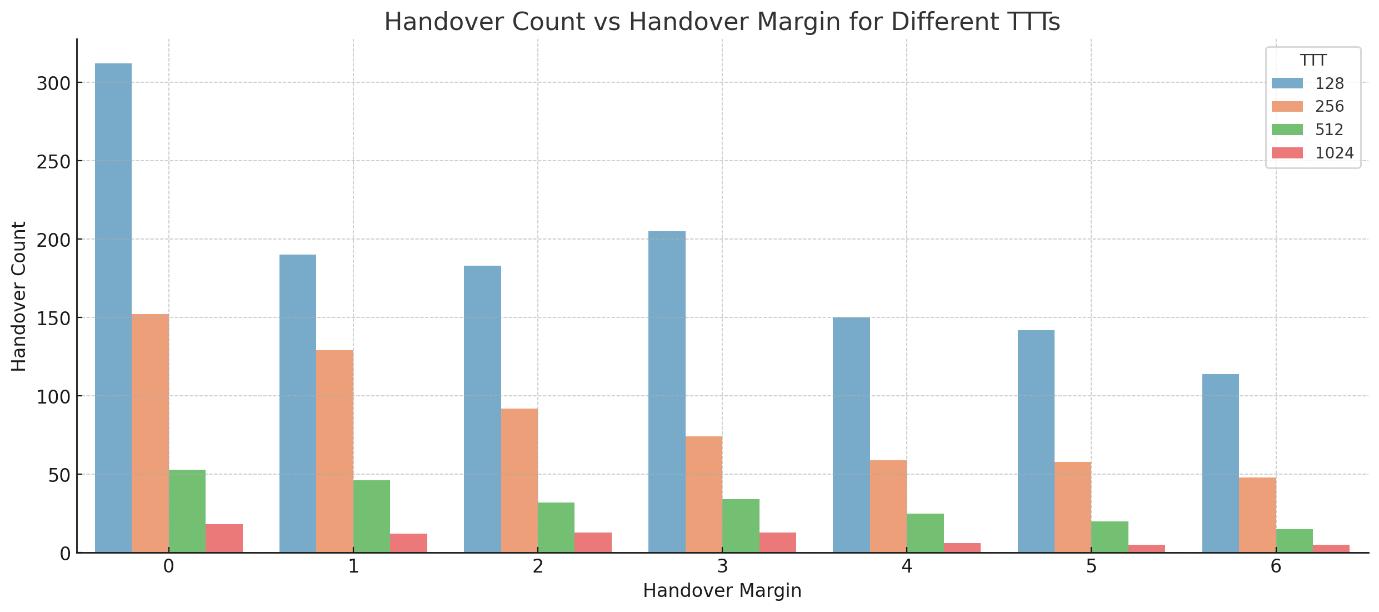
The plot shows that the handover count decreases as the handover margin increases. The trend is the same for each TTT value, so a higher handover margin usually gives fewer handovers. The reason is that a larger handover margin makes the handover condition stricter, so handovers occur less often. Shorter TTT values lead to quicker responses to signal changes, resulting in more frequent handovers, while longer TTT values delay the handover process, thereby reducing the handover count. The plot shows the effects of the handover margin and the TTT on the handover count.

In the second chart, we see that sum throughput generally rises and then falls with increasing handover margin. For each handover margin we see the throughput again roughly increases and then drops as TTT increases. At first, a higher handover margin, a higher TTT, or both prevent unnecessary and frequent handovers between cells. This leads to better throughput, but only to a certain extent. Beyond a point, a high handover margin and/or high TTT causes delayed handovers. Users may stay connected to a weaker cell longer, despite being closer to a stronger cell, leading to poorer signal quality and thus lowering throughput.