Drone Swarm Communication over TDMA MANET and Satellite
Overview
This simulation models a tactical drone swarm communication system that integrates both TDMA-based MANET radios and satellite links. Each drone is equipped with two communication interfaces—one for MANET connectivity over the C-band and another for satellite communication over the X-band. The scenario represents a real-world military setup in which communication happens simultaneously across both interfaces. The central command server transmits Command & Control (C2) data to all drones via the satellite link at a rate of 25 kbps. In return, each drone sends Telemetry and Status Reports to the server every 3 seconds at 50 kbps, also via the satellite link. At the same time, drones exchange Intra-swarm Coordination data among themselves over the TDMA-based MANET, using direct or multi-hop communication paths. As drones follow predefined mobility paths, the network automatically updates the MANET routes to ensure consistent inter-drone connectivity. The system’s performance is analyzed in terms of end-to-end latency and throughput under dynamic, mobility-driven topology changes.
Network Scenario
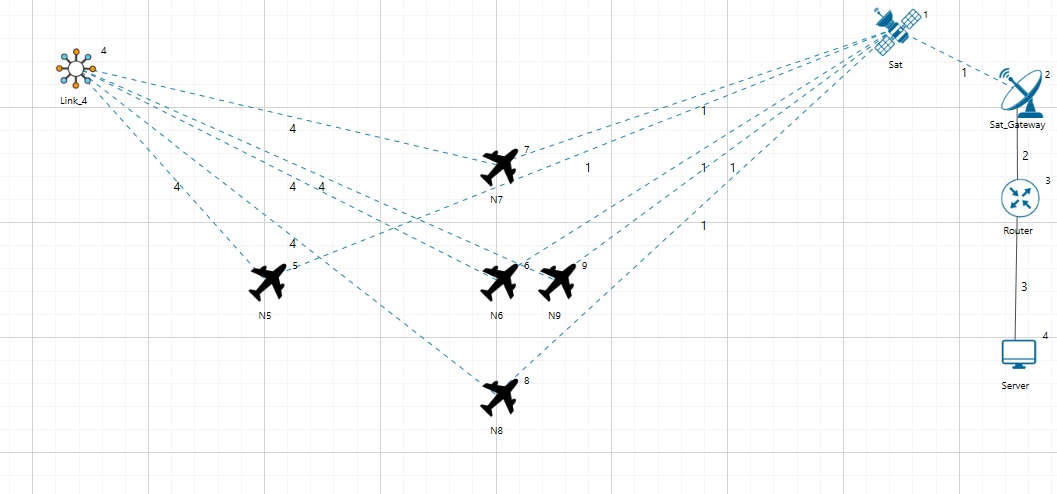
Figure 1: 5 drones; 1 satellite; 1 satellite gateway; 1 server. Each drone has a TDMA radio interface and a satellite interface. Link-4 is a logical TDMA ad hoc link.
Network Setup
Communication Range: 150 km for TDMA radios
Network: 5 drones, 1 satellite, 1 Gateway, 1 Central Server
X-Band Satellite Communication
The server transmits Command & Control (C2) data to the drones at 25 kbps via the satellite link.
The drones transmit Telemetry & Status Reports to the server at 50 kbps, every 3 seconds, via the satellite link.
X-band is used for both forward and return Satellite Communication.
C-Band MANET communication
Node N1 transmits Intra-swarm Coordination data to Node N5 at 10 kbps over the TDMA link.
Drone Communication Range (MANET): 150 km.
C-band is used for TDMA-based MANET communication.
Drone Mobility Configuration
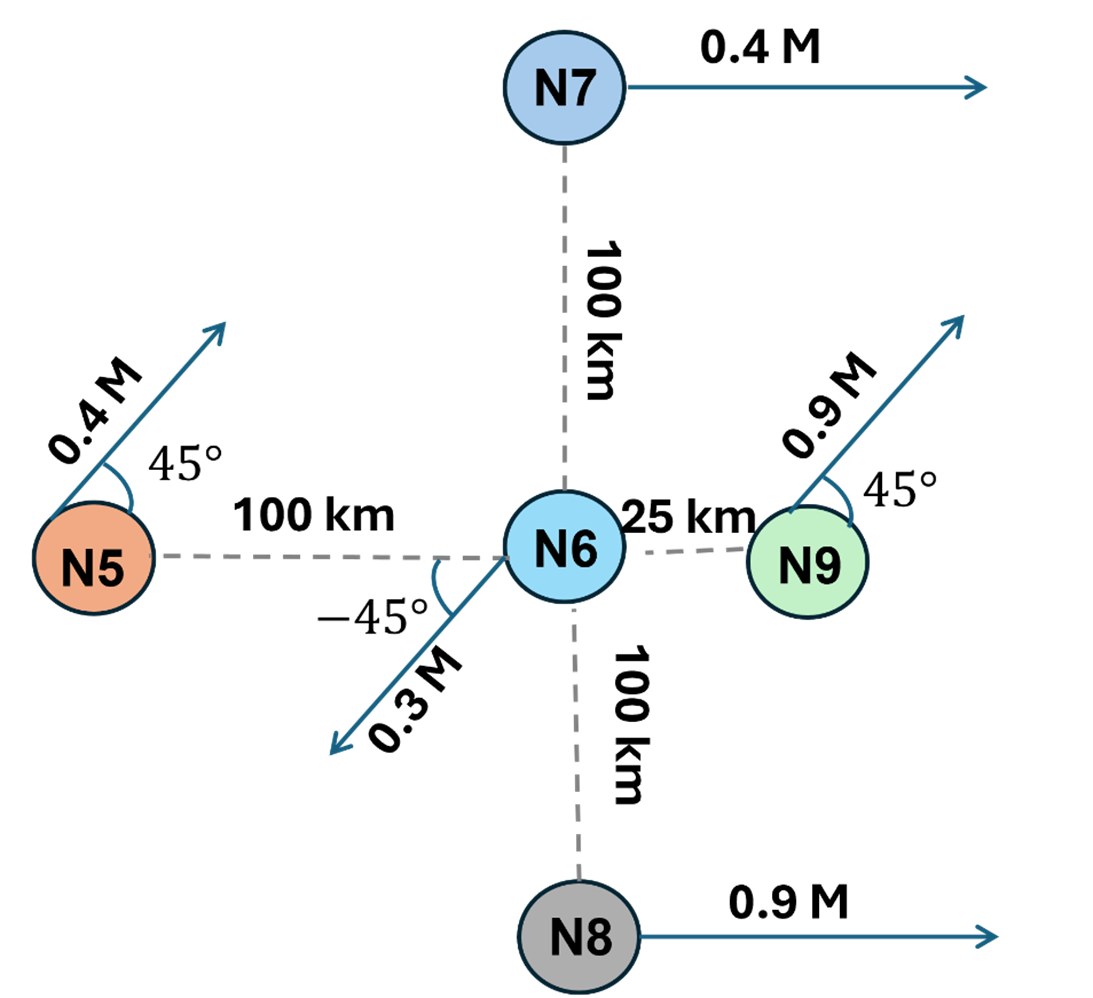
N5 and N9 move northeast at 0.4 m/s and 0.9 m/s.
N7 and N8 move east at 0.4 m/s and 0.9 m/s.
N6 moves southwest at 0.4 m/s.
Mobility Configuration: File-based mobility for predefined flight path
Figure 2: Initial Position and Velocities. NetSim assumes that nodes have appropriate Doppler compensation mechanisms
Routing Transitions Due to Mobility
Time Interval
Communincation Path
Type
0s – 191s
N5 > N9
Direct
198s – 318s
N5 > N6 > N9
Multi-hop
324s – 900s
N5 > N7 > N9
Multi-hop
Table 1: Time Intervals and Routing Paths Between N5 and N9
System Parameters: Satellite
Parameter
Value
Satellite Type
GEO
Modulation
QPSK
Coding Rate
3/4
Frequency (GHz)
7.9 for forward, 7.25 for return
Bandwidth (MHz)
1
Roll of Factor
1
Spacing Factor
1
Symbol per slot
90
Pilot block size (Symbols)
36
Slot count in frame
360
Pilot header (Slots)
1
Pathloss model
Friis free space
Table 2: Satellite System Parameters
System parameters: MANET
Parameter
Value
Routing protocol
OLSRv1-RFC 3626
Slot allocation
Round robin
Bandwidth (KHz)
20
Data Symbol Rate (Kbd)
1000
Pathloss model
Range based
Range (km)
150
Transmit power (W)
20
Modulation
QPSK
Coding Rate
1/2
Table 3: MANET System Parameters
Understanding the multi-hop Routes taken through Animation
Animation
Results
On analysing NetSim’s packet trace log file we observe the multi-hop routes as shown in the table below:
0s to 191s: Direct communication (N5 → N9)
198s to 318s: Multi-hop communication (N5 → N6 → N9)
324s to 900s: Multi-hop communication (N5 → N7 → N9)
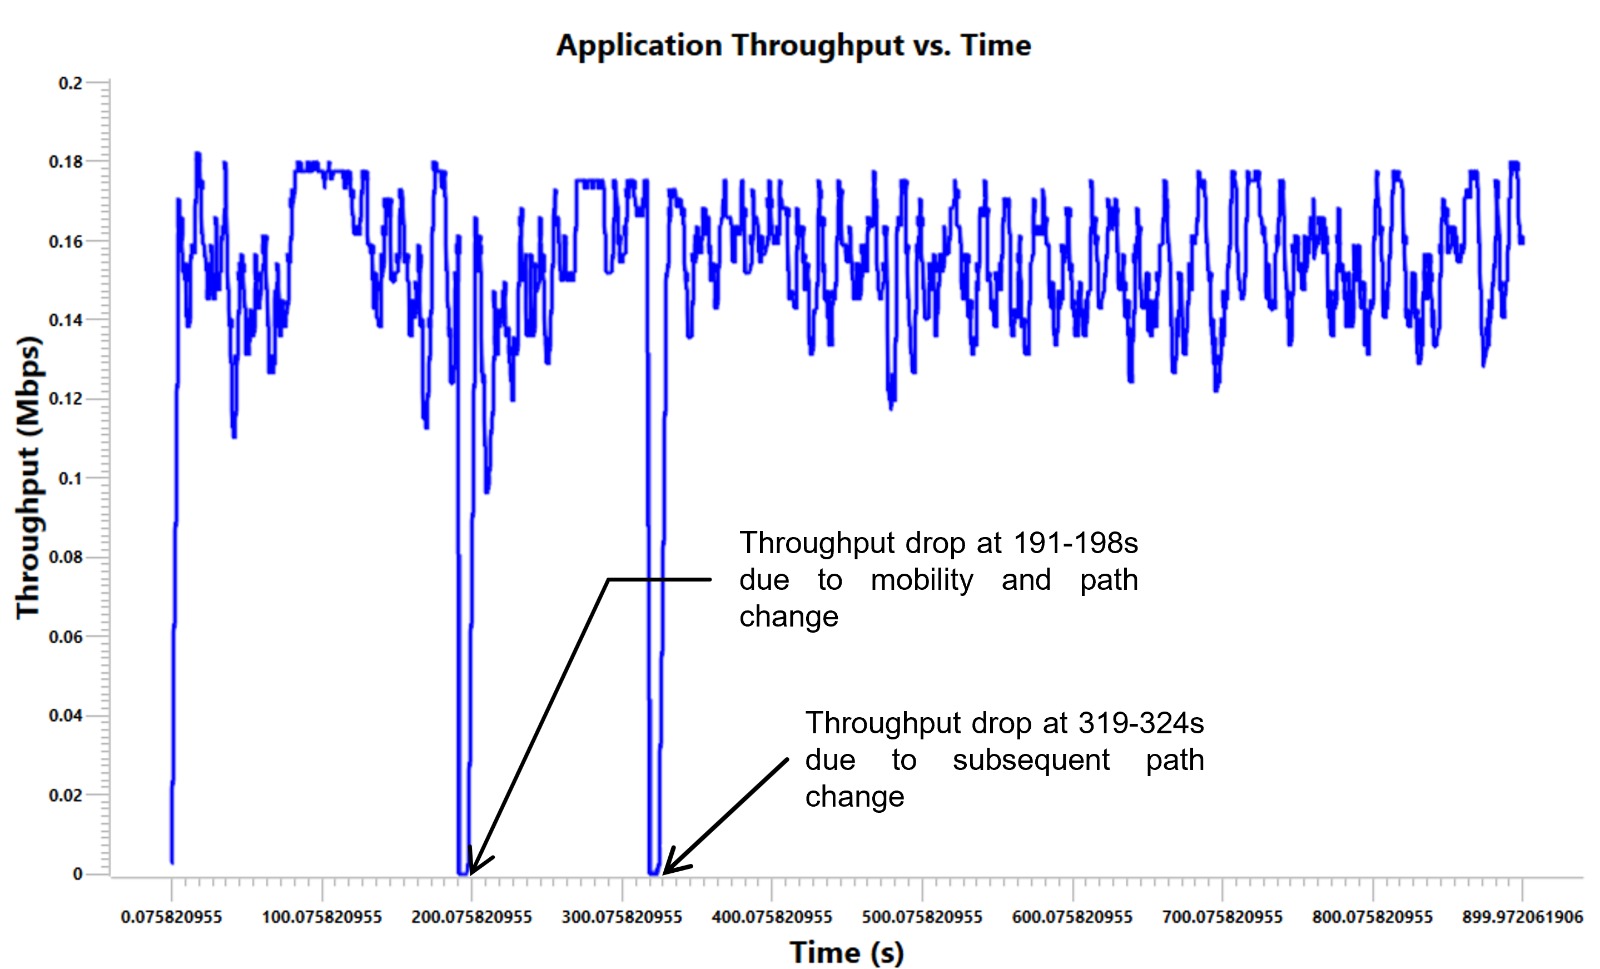
Throughput vs Time
Figure 3: Throughput remains stable initially due to direct communication. A drop occurs at 191-198s due to mobility and a path change. Another drop happens at 319-324s due to a subsequent path change.
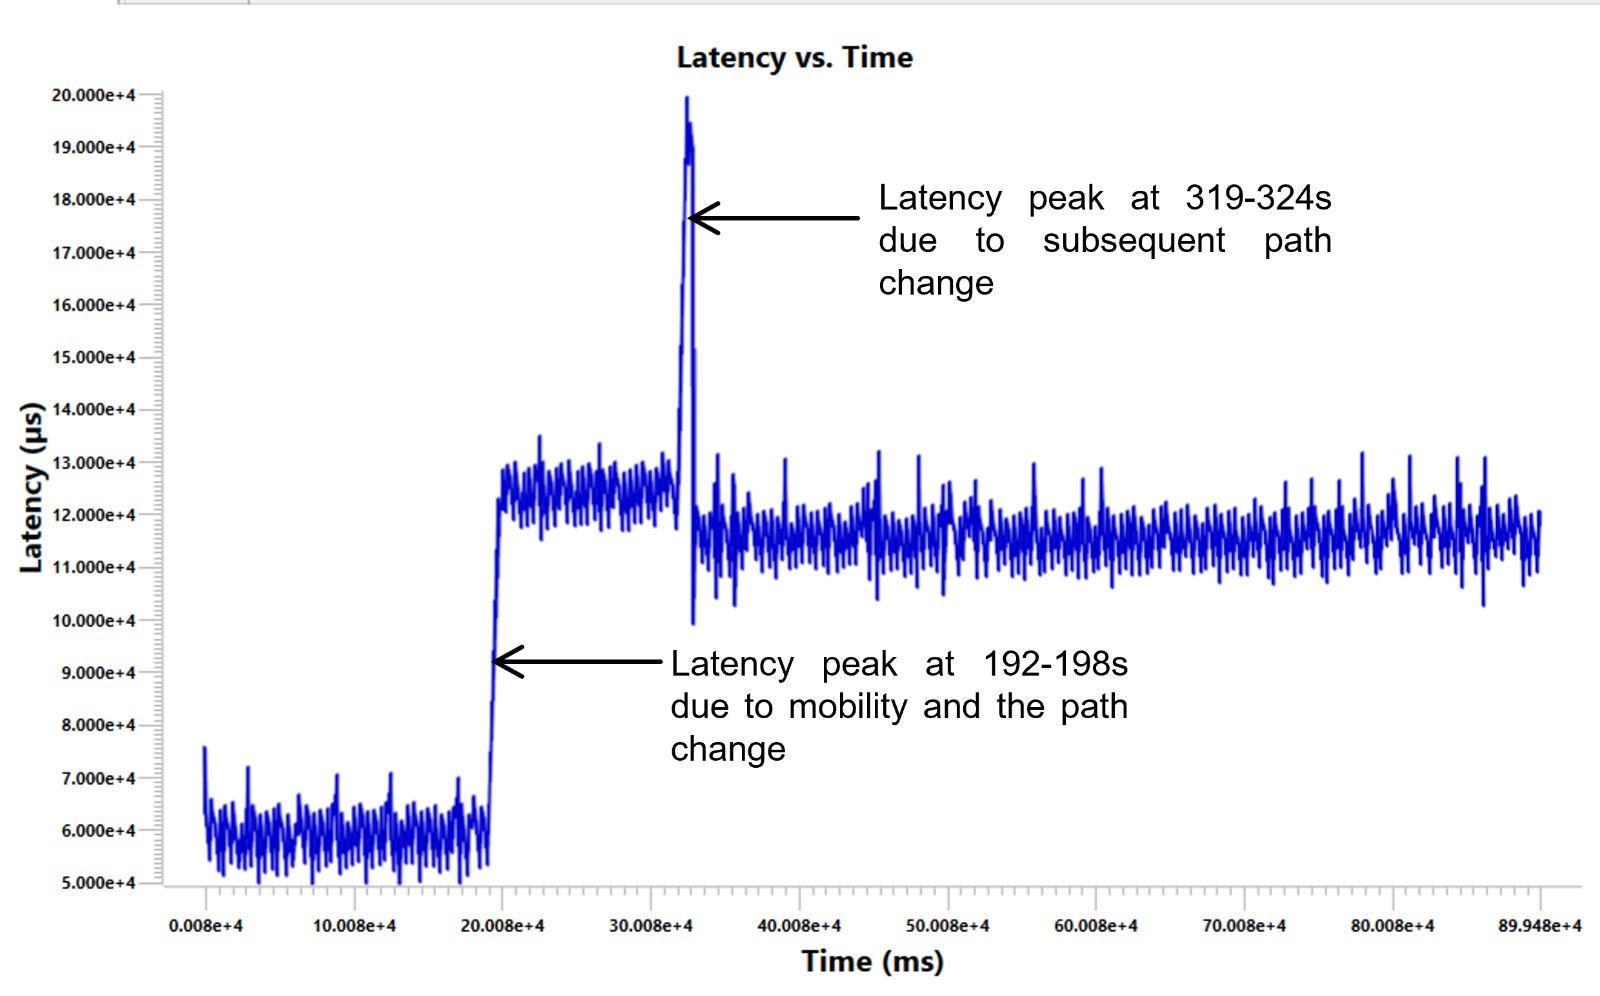
Latency vs Time
Figure 4: Low latency initially due to direct communication (up to 190s). A latency peak occurs at 191-198s due to mobility and a path change. Another peak is observed at 319-324 due to a subsequent path change. Latency remains higher afterward due to multi-hop communication.
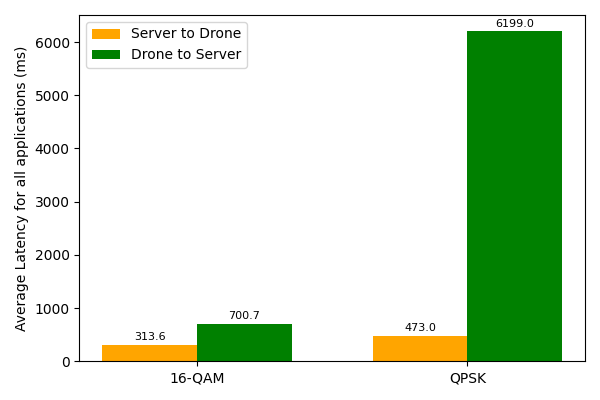
Satellite communication: Latency. QPSK vs QAM
Figure 5: Average latency for the QPSK is greater than the average latency of 16-QAM.
The simulation results show that 16-QAM modulation achieves significantly lower average latency compared to QPSK, especially in the Drone-to-Server communication direction. With 16-QAM, the target latency of less than 1 second (1000 ms) is achieved on average, with an overall mean latency of 700.68 ms across five applications, making it suitable for time-sensitive telemetry transmissions from drones.