3GPP 38.821 System Level Simulation of Reference Scenario
This simulation is based on the Set 1 Reference Scenario from 3GPP TR 38.821, which provides guidelines for evaluating the performance of Non-Terrestrial Networks (NTN) with Low Earth Orbit (LEO) satellites. In this setup, the satellite uses a transparent payload, meaning it acts as a relay, passing signals between the ground gateway and the User Equipment (UE).
Objective
The goal is to measure the distributions and percentiles of SINR and throughput across multiple spot beams, with each beam containing multiple UEs.
 ▶
2:42
▶
2:42
3GPP 38.821 Set-1 Reference Scenario
Network Scenario
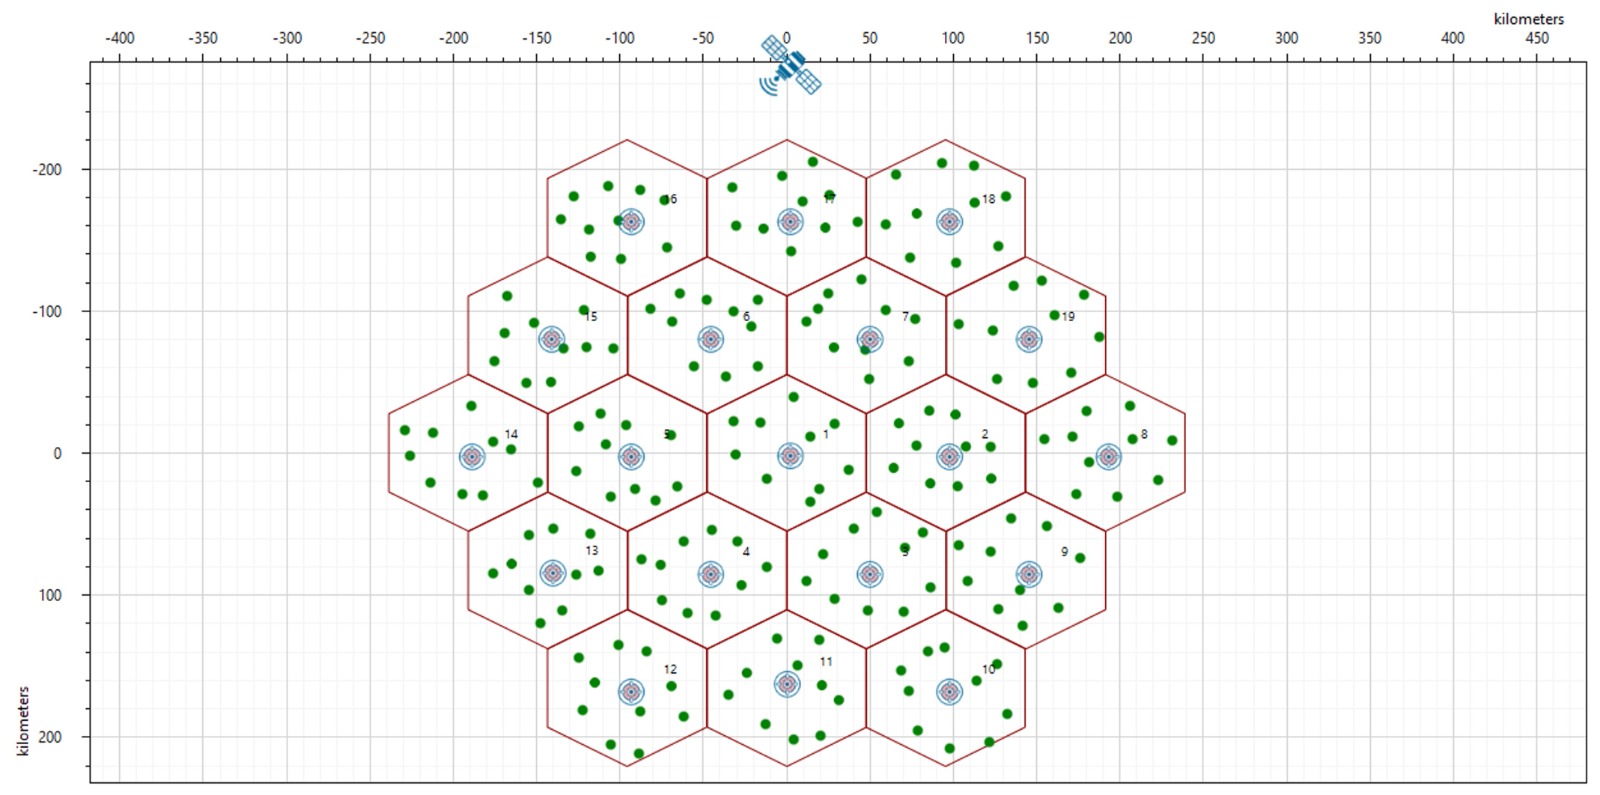
Figure 1: 19 beams arranged in a hexagonal layout; S-band, LEO orbit; total 190 UEs (10 UEs per beam) connected via a transparent satellite relay with full buffer DL traffic.
Parameter configuration
| Evaluation parameters | |
|---|---|
| Satellite Orbit | LEO 600 |
| Satellite Altitude | 600 km |
| EIRP (dBW/MHz) | 34 |
| Noise Figure (dB) | 7 |
| Antenna Aperture (m) | 1 |
| Band | S |
| Frequency | 2 GHz (S Band) |
| Bandwidth (MHz) | 30 per beam |
| Scheduling Type | Round robin |
| Traffic | Full buffer DL |
| RU% | 100% |
| Elevation Angle | Beam centres are at elevation angle 90°. The UE’s elevation angle would depend on its location within the beam. |
| Antenna Pattern | Bessel function per section 6.4.1 of TR 38.811. All UEs are not at the Nadir point and hence antenna gains need to be computed. |
| Additional Loss(dB) | 0 |
| Clutter Loss (dB) | 0 |
| UE Density | 10 UEs per spot beam |
| UE Mobility | No Mobility |
| Antenna Temperature (k) | 290 |
| UE TX Power (dBm) | 23 |
| UE RX Antenna Gain (dB) | 0 |
| Traffic Model | Full buffer |
Table 1: System simulation parameters.
Results and Discussion
The results of the simulation are shown using CDF plots for SINR, UE Throughput and Beam throughput.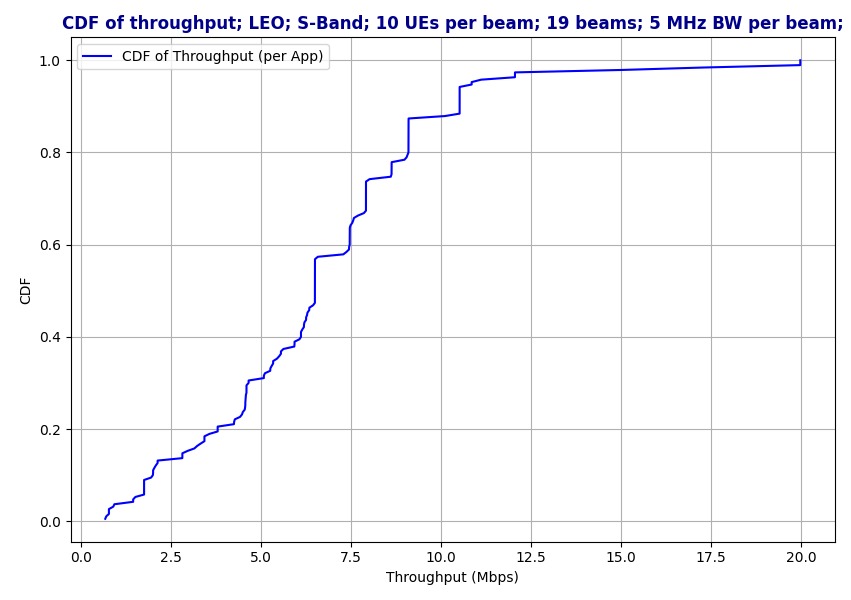
| Throughput percentile metrics | |
|---|---|
| 5th percentile | 1.62 Mbps |
| 50th percentile | 6.49 Mbps |
| 95th percentile | 10.85 Mbps |
Figure 2: CDF of downlink throughput per UE; LEO satellite network using S-Band with 19 beams and 10 UEs per beam.
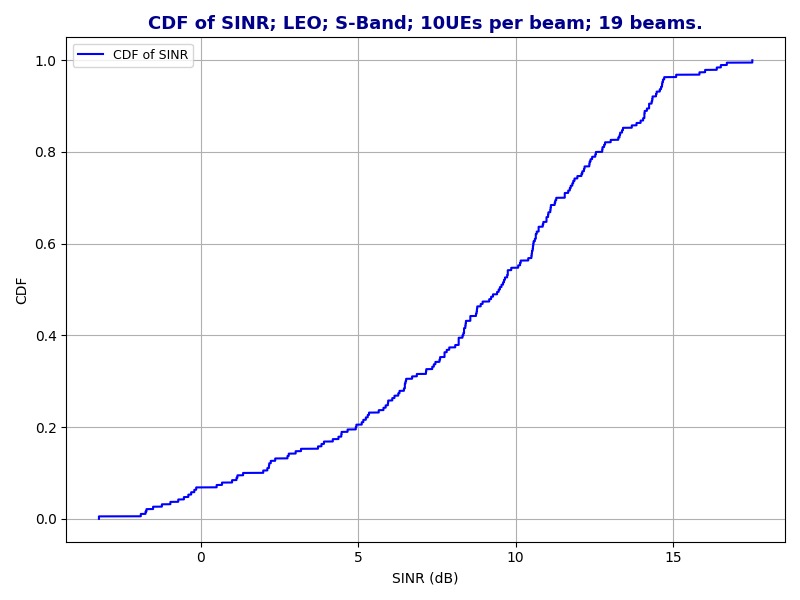
| SINR percentile metrics | |
|---|---|
| 5th percentile | -0.40 dB |
| 50th percentile | 9.50 dB |
| 95th percentile | 14.66 dB |
Figure 3: CDF of SINR ; LEO; S-Band; 10UEs per beam; 19 beams
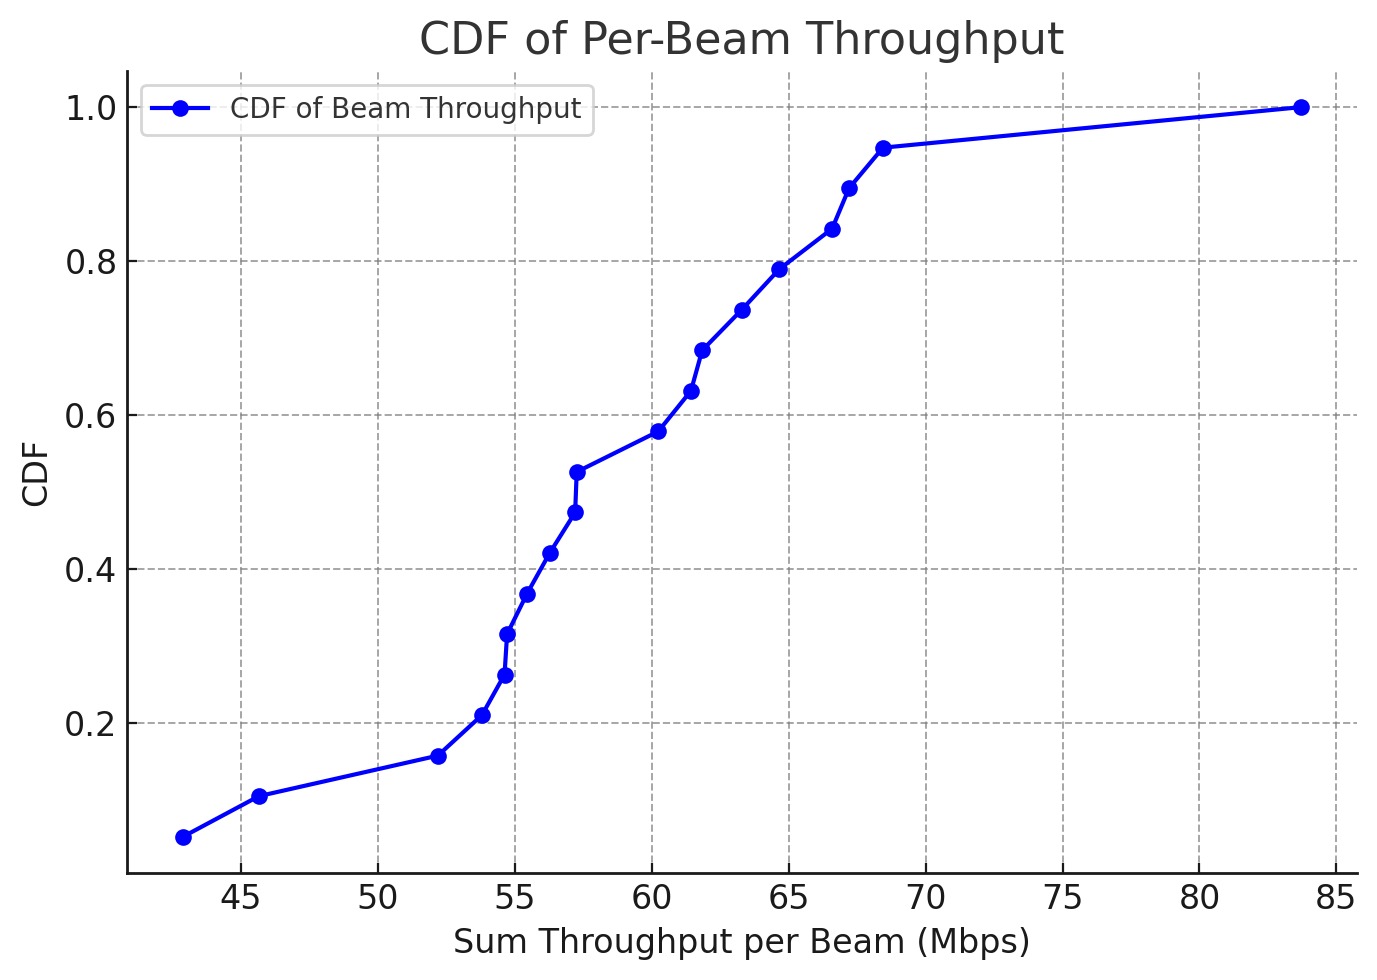
| Per-Beam Throughput percentile metrics | |
|---|---|
| 5th percentile | 45.39 Mbps |
| 50th percentile | 57.27 Mbps |
| 95th percentile | 69.97 Mbps |
Figure 4: CDF of Per-Beam Throughput.
The SINR CDF shows how the signal quality changes based on the user’s location within a beam. UEs near the beam center usually have better SINR, while edge UEs see lower values due to reduced antenna gain.
The throughput CDF shows how throughput is distributed among UEs. The scheduling is Round Robin scheduling and all UEs have full buffer traffic. UEs with higher SINR achieve slightly better throughput.
The per-beam throughput CDF shows how sum throughput varies across beams. Each beam has the same bandwidth and number of UEs, but performance depends on SINR which depends on UE location within the beam. Due to randomness in the UE positions we see a distribution in the per beam throughputs.
Satellite capacity
- Satellite capacity = 1127.54 Mbps (Sum throughput of all 190 UEs)
Area Traffic Capacity
- Number of beams = 19
- Beam radius, R = 55.13 km
- Area per beam (A)
\[ A = \frac{3\sqrt{3}}{2} \cdot R^2 = \frac{3\sqrt{3}}{2} \cdot (55.13)^2 = 7887.1 \text{ km}^2 \]
- Total coverage area:
\[ 7887.1 \text{ km}^2 \times 19 = 149854.9 \text{ km}^2 \]
- Area Traffic Capacity:
\[ \frac{1127.54 \text{ Mbps}}{149854.9 \text{ km}^2} = 0.007526 \text{ Mbps/km}^2 = 7.526 \text{ kbps/km}^2 \]
Average Spectral Efficiency
- Channel Bandwidth = 30 MHz
- Number of TRxPs = 19
-
Average Spectral Efficiency:
\[ \frac{1127.54 \times 10^6}{30 \times 10^6 \times 19} = 1.98 \text{ bits/s/Hz/TRxP} \]