5G scheduling: Throughput and Fairness
Analyse throughput and fairness of 5G scheduling algorithms in a complex network scenario.
We analyse a multi-gNB, multi-UE environment with full buffer and non-full buffer traffic scenarios. It also incorporates user mobility and channel fading effects to model the dynamic wireless communication environment. The goal is to examine the performance of different scheduling algorithms in practical 5G network deployments where users move, the channel quality varies, and traffic demands fluctuate.
Network Scenario
The scenario comprises of 3 gNBs placed in a triangular configuration. There are 10 UEs per, gNB, and the Inter gNB distance is 2 km.
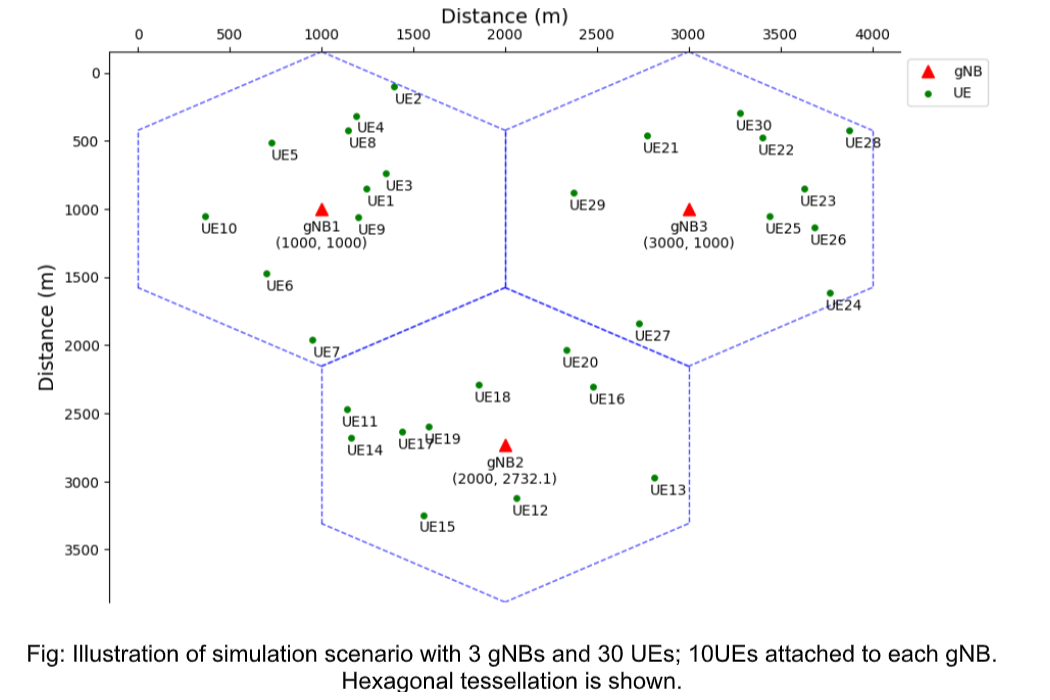
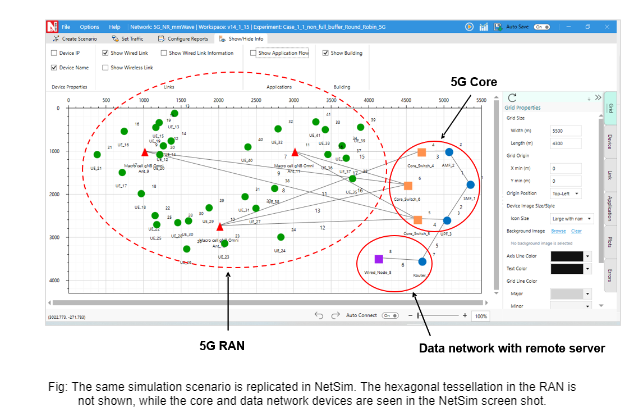
NetSim UI would display the network topology shown in the screenshot below when you open the configuration file.
Settings
| Scheduling Algorithm | RR / PFS / Max Throughput |
| TX Power (dBm) | 40 |
| CA Type | Single band |
| CA Configuration | n78 |
| DL UL Ratio | 01:01 |
| Numerology | 2 |
| Channel Bandwidth (MHz) | 100 |
| TX x RX Antenna Counts | 1 x 1 |
| MCS Table | QAM256 |
| Pathloss Model | Log distance |
| Pathloss Exponent | 3 |
| Shadowing Model | NONE |
| Fading and Beamforming | No fading and Rayleigh fading |
| DL Interference Model | Exact geometric model |
| Mobility Model | No mobility and Random walk |
| TX x RX Antenna Counts | 1 x 1 |
| Random Walk Velocity (m/s) | 10 |
Application (Traffic Flow) Settings
| Application settings | Non-full buffer traffic | Full buffer traffic |
| Packet Size (B) | 1460 | 1460 |
| Inter Arrival Time (µs) | 10000 | 170 |
| Mean Generation Rate (Mbps) | 1.17 | 68.71 |
Throughput analysis and Comparison
| Case # | Traffic Type | Sum Throughput (Mbps) | ||
|---|---|---|---|---|
| Round Robin | Proportional Fair | Max Throughput | ||
| Case 1 & 2 No fading, no mobility |
Non-Full Buffer | 34.44 | 34.44 | 16.34 |
| Full Buffer | 214.39 | 214.39 | 396.52 | |
| Case 3 & 4 Rayleigh fading, no mobility |
Non-Full Buffer | 33.75 | 33.92 | 23.35 |
| Full Buffer | 181.22 | 249.66 | 415.70 | |
| Case 5 & 6 No fading, with mobility |
Non-Full Buffer | 34.44 | 34.44 | 17.10 |
| Full Buffer | 211.41 | 210.97 | 382.77 | |
| Case 7 & 8 Rayleigh fading, with mobility |
Non-Full Buffer | 33.80 | 33.98 | 25.22 |
| Full Buffer | 180.90 | 251.39 | 416.62 | |
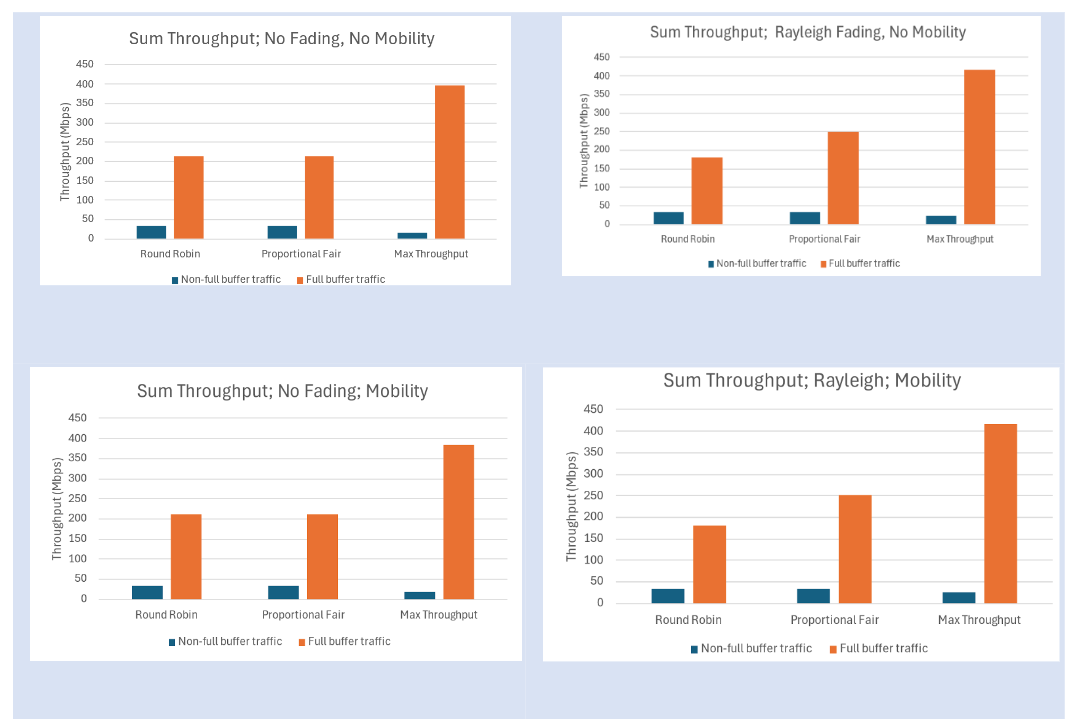
Why does the Max Throughput Scheduler perform better than RR and PFS in full buffer cases?
- MT scheduler prioritizes users with better channel conditions for transmission.
- With full buffer traffic, there is always data to transmit from all users.
- By prioritizing users with better channels, MT can transmit more data than PFS or RR, maximizing throughput
Why does Max throughput perform worse than RR and PFS in the non-full buffer cases?
- Both PFS and RR inherently cycle through users, ensuring that those with intermittent data ready to transmit are not left waiting.
- By guaranteeing that transmission opportunities are distributed regularly among users, the RR and PFS schedulers prevent the scenario where the channel is underutilized because of the lack of continuous data.
- This cycling is crucial in non-full buffer scenarios where data demands are sporadic.
- The MT scheduler, however, only gives transmission opportunities to the user with the best channel. It may happen that this user has no data to transmit.
- This leads to RR and PFS outperforming MT in terms of throughput.
Fairness
Raj Jain’s equation

rates the fairness of a set of values where there are n users, xi is the throughput for the ith connection. The result ranges from 1/n (worst case) to 1 (best case), and it is maximum when all users receive the same allocation.
Jain’s Fairness Index
| Case # | Traffic Type | Round Robin | Proportional Fair | Max Throughput |
|---|---|---|---|---|
| Case 1 & 2 No fading, no mobility |
Non-full buffer | 1 | 1 | 0.48 |
| Full buffer | 0.71 | 0.71 | 0.22 | |
| Case 3 & 4 Rayleigh fading, no mobility |
Non-full buffer | 1 | 1 | 0.77 |
| Full buffer | 0.71 | 0.75 | 0.29 | |
| Case 5 & 6 No fading, with mobility |
Non-full buffer | 1 | 1 | 0.51 |
| Full buffer | 0.71 | 0.71 | 0.21 | |
| Case 7 & 8 Rayleigh fading, with mobility |
Non-full buffer | 1 | 1 | 0.84 |
| Full buffer | 0.71 | 0.74 | 0.29 |
Discussion
No Mobility, with and without Rayleigh Fading
- No Fading:Jain's fairness index is highest for Round Robin and Proportional Fair algorithms, both achieving perfect scores (1.0), indicating that resources are distributed equally among all users. Max Throughput has a significantly lower fairness index, as it tends to favor users with better channel conditions, leading to unequal resource distribution.
- With Rayleigh Fading: The introduction of Rayleigh fading slightly reduces the fairness for Round Robin and Proportional Fair, though they still maintain relatively high scores. Max Throughput’s fairness index improves slightly compared to the no-fading scenario, likely due to the overall reduction in SINR which somewhat levels the playing field among users.
With Mobility, with and without Rayleigh Fading
- No Fading: Mobility introduces more variability in channel conditions. Here, the fairness indices for Round Robin and Proportional Fair remain high, albeit slightly lower than in stationary cases. Max Throughput shows a noticeable dip in fairness, due to dynamic channel conditions.
- With Rayleigh Fading: Mobility combined with Rayleigh fading results in further reduced fairness for all algorithms, particularly Max Throughput. Round Robin and Proportional Fair perform better but still show reduced fairness compared to stationary, non-fading conditions